Reverse engineer a gigantic framework in 5 minutes using a tracing tool
A huge Java framework can contain millions of lines of code. Understanding the internal structures is not an easy task. Such frameworks can be reverse engineered with the help of some tools. This article shows how to dig into Spring Web internals with the help of ulyp in less than 10 minutes. A developer can observe how the framework works inside before diving into source code. This is part 2 of the ongoing blog series about ulyp. The first part is available here.
Introduction
When working with gigantic frameworks, the main issue is to understand their codebases. Sometimes, a developer needs to get an understanding of internals really quick. This can happen when something doesn’t work as expected, but basic debugging doesn’t help much.
Some of the ways to get into the codebases:
- Use a plain old debugger. Stop the app at some breakpoint and check the stack trace and surrounding types.
- Dive right into the source code with the obtained knowledge.
- Start from tests. Tests can be quite helpful if one wants to understand the codebases.
- Enable
TRACElogs and try to gather some info from them. - Use a sampling profiler. Building a flamegraph could be quite a good idea to start from. This can be quite useful if the app being analyzed is already under load.
- Use a tracing debugger, which records the whole execution flow and then can show the call tree.
This article focuses on the last approach. In certain cases, using such a tool might be useful for anybody who works with large codebases. Recorded execution flow can be used to get the idea how things work at runtime. A developer can then dive into source code with good understanding.
Reverse engineering Spring Web
We will see how the tool works on a Spring Web based app. The project that we are going to use is spring-petclinic. This is a basic web app written in Java with Spring Web. Suppose we want to understand how it works. And we want to do it really quick.
We will skip the setup and jump right to the recording. The first thing we want to know is where to start the recording. This can be done in plenty of ways, but the easiest way is to gather some stack traces. If we stop inside the controller, we see the top of the stack trace is
    <app methods>
    ...
    <other spring methods>
	at org.springframework.web.filter.CharacterEncodingFilter.doFilterInternal(CharacterEncodingFilter.java:201)
	at org.springframework.web.filter.OncePerRequestFilter.doFilter(OncePerRequestFilter.java:116)
	...
    <tomcat methods>
	at java.base/java.lang.Thread.run(Thread.java:1583)
Since we want to reverse engineer Spring Web, we’d like to start from the bottom of the stack trace. This is org.springframework.web.filter.OncePerRequestFilter
in our case. It’s the first called method of the Spring framework.
If we want to record the execution, we should configure ulyp first. We specify the following system properties when we start the petclinic app, no code change is required.
-javaagent:/home/tools/ulyp/ulyp-agent-1.0.2.jar
-Dulyp.methods=**.OncePerRequestFilter.doFilter
-Dulyp.file=/tmp/test-petclinic.dat
-Dulyp.record-constructors
-Dulyp.record-collections=JDK
-Dulyp.record-arrays
Specifying -Dulyp.methods=**.OncePerRequestFilter.doFilter makes ulyp start recording whenever doFilter method of
any class named OncePerRequestFilter is called. -Dulyp.file=/tmp/test-petclinic.dat specifies the output filepath.
The other props enable additional recording features which is optional.
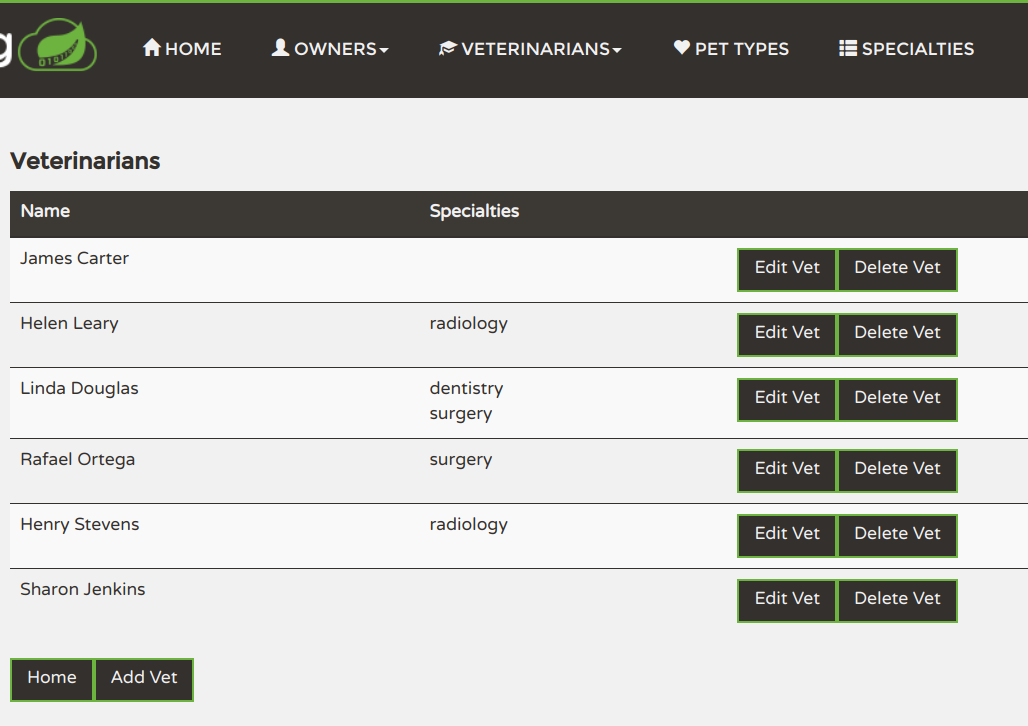
We open the UI at the URL http://localhost:4200/petclinic/vets which lists all veterinarians. We stop the app afterward, since ulyp
writes everything to the output file immediately.
Now we want to see what’s recorded. ulyp comes with a desktop app that can open recording files. If we
open the /tmp/test-petclinic.dat file, we can observe that there is indeed some recorded data.
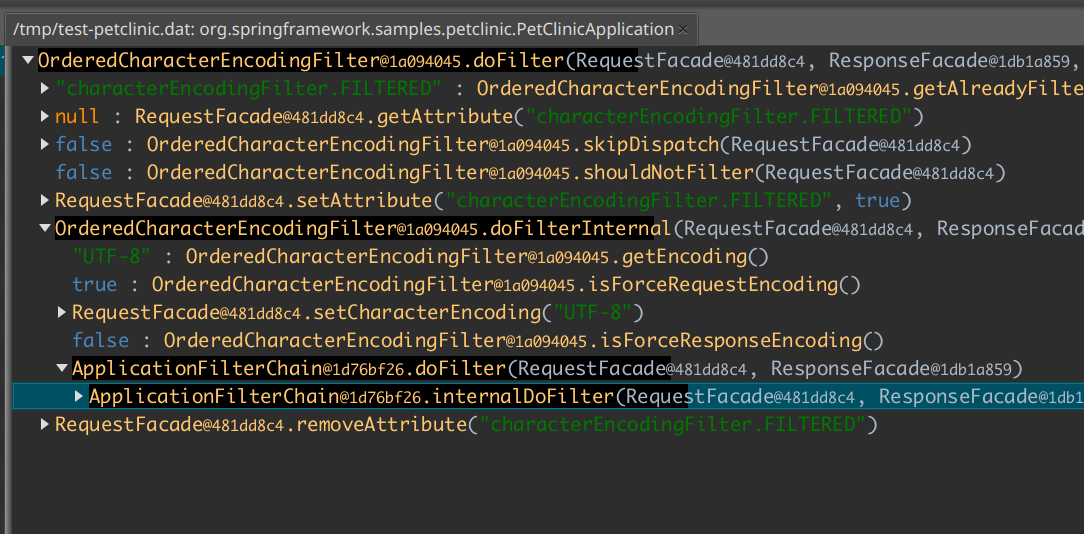
What we see is a recorded call tree. The top method is OncePerRequestFilter.doFilter as we expected. The next level consists of
methods that were called inside the method call (basically, children). The black background line hints at how many calls are inside every subtree.
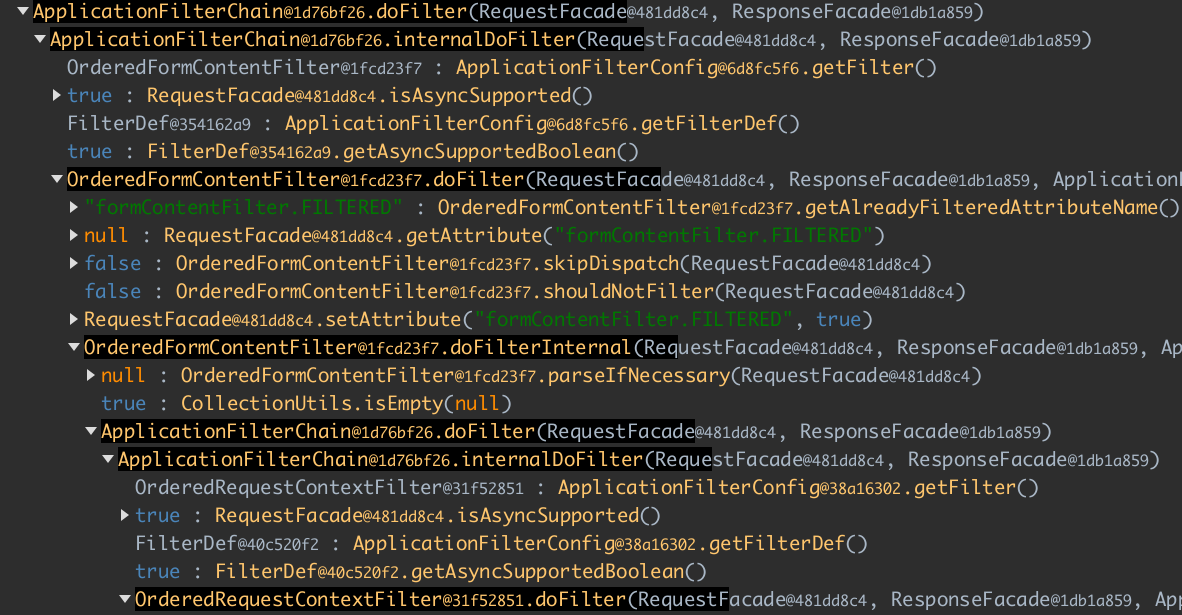
We can unfold every method call that has nested calls recorded. If we unfold further down, we can get an overall idea.
Spring Web implements the chain of responsibility pattern. So
every filter does some work and then calls the next filter. Here we see that OrderedFormContentFilter calls
OrderedRequestContextFilter.
You can read more about Servlet-based application architecture here.
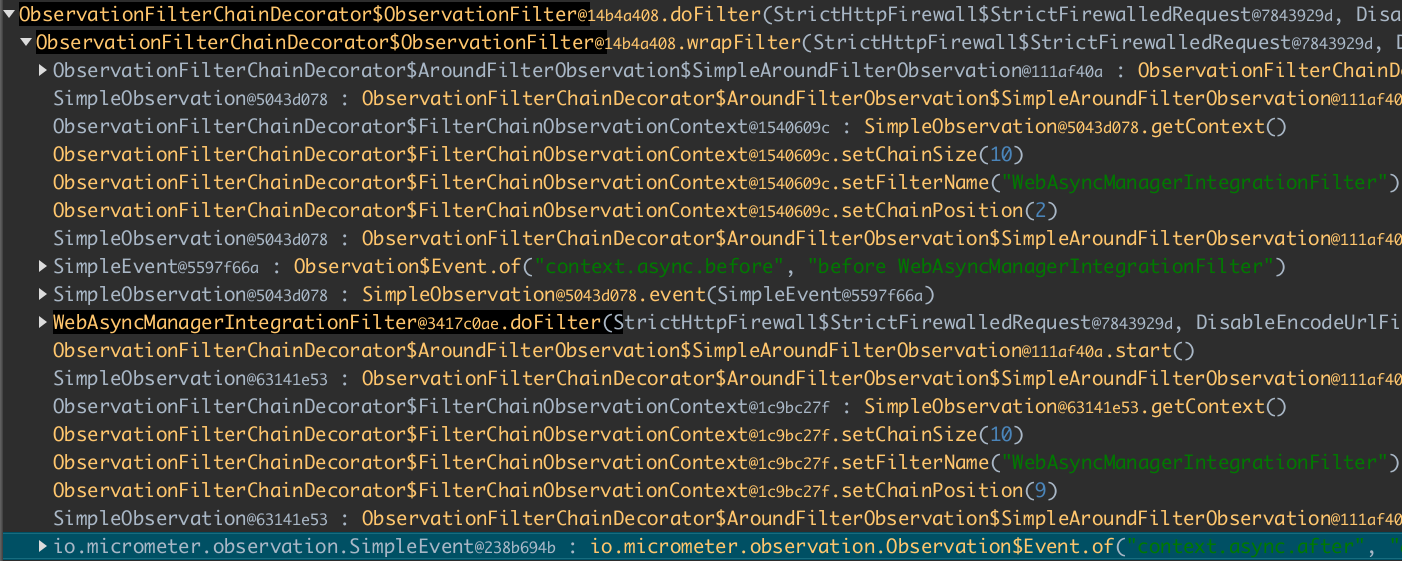
If we dig down, we can observe how Spring Web creates Micrometer events. Other stuff is updating the context that can be accessed from other filters.
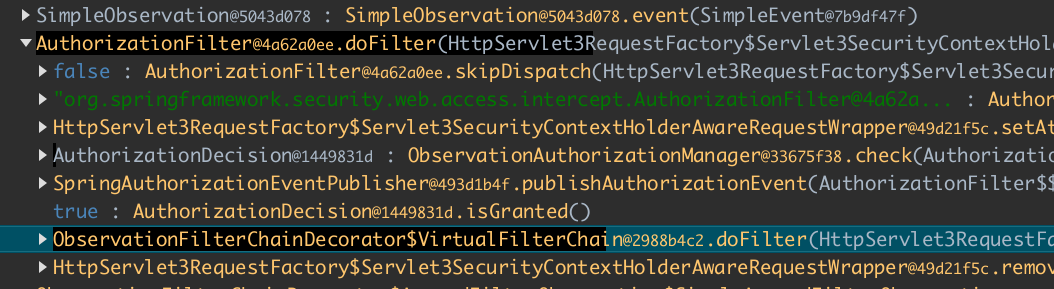
There are also many filters that are called on the path. The next interesting one is the AuthorizationFilter. We can
see how it calls the ObservationAuthorizationManager.check method, which returns an instance of AuthorizationDecision.
The filter later checks that AuthorizationDecision.isGranted returns true, which means the user has access.
Next, we can see how DispatcherServlet.doDispatch is called, which does some logic, and finally we see that our controller is called.
The VetController returned a list of Vet objects.
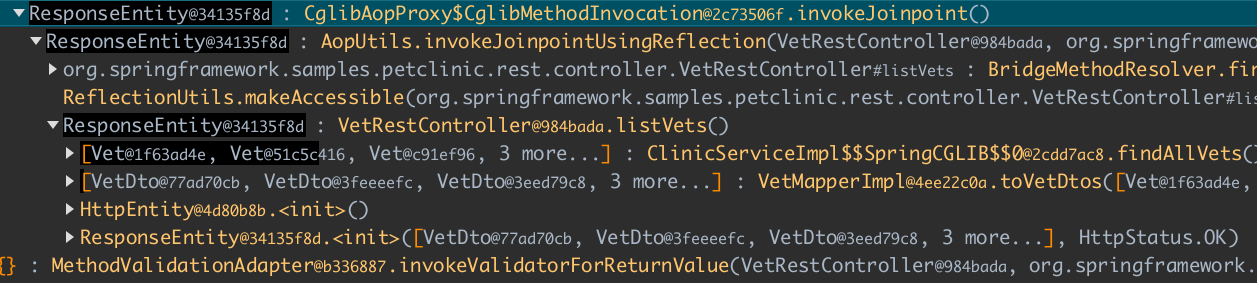
Basically, we can check how Spring MVC works, calls filters, validators, maps the response into JSON, etc. Every method is recorded and can later be analyzed.
If we wanted to, we could dig down to the Hibernate or even JDBC level, but that’s not the point of this article. There is another article that shows how ulyp handles Hibernate.
Conclusion
This article showed how a developer can record and analyze the internals of a large framework. The obtained knowledge can help in development. Feel free to try ulyp while working on a huge codebase.