Ulyp: Tracing Java code execution flow for faster debugging
Ulyp is a tracing debugger and a reverse engineering tool for JVM apps. Ulyp is able to record absolutely all method calls of any application along with return values and arguments. This blog post shows how the tool can help investigate the internals of the Hibernate framework.
Introduction
This article presents Ulyp, which is an open-source instrumentation agent that records method calls (including arguments and return values) of all third-party libraries of JVM apps. A software engineer can later upload a recording file to the UI desktop app in order to better understand the internals of libraries and even whole applications. The tool can help developers understand the internals of frameworks faster, gain deeper insights, find inefficiencies in software, as well as debug more effectively.
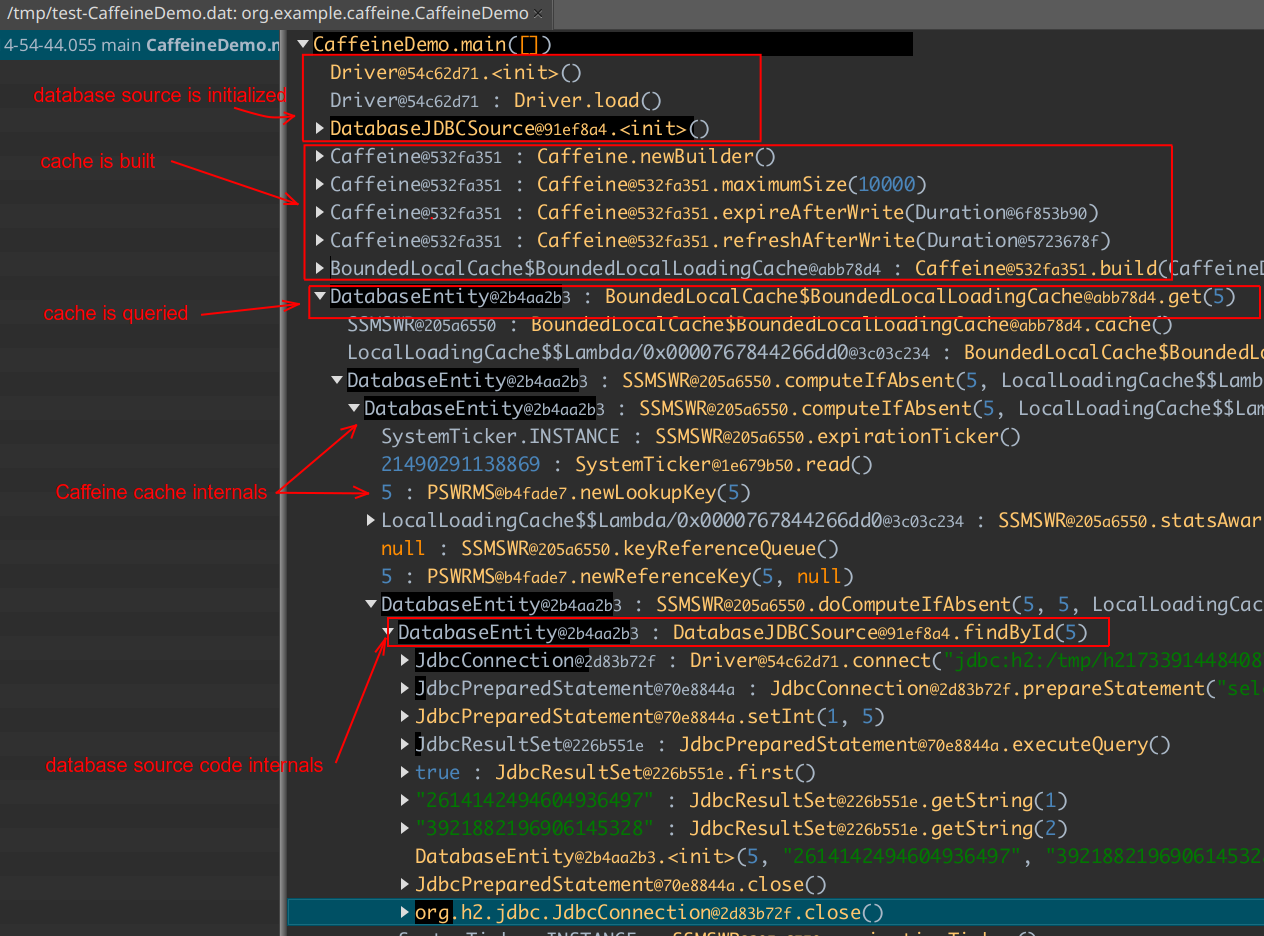
In a few words, Ulyp converts this:
DatabaseJDBCSource source = new DatabaseJDBCSource();

LoadingCache<Integer, DatabaseEntity> cache = Caffeine.newBuilder()
        .maximumSize(10_000)
        .expireAfterWrite(Duration.ofMinutes(5))
        .refreshAfterWrite(Duration.ofMinutes(1))
        .build(source::findById);

DatabaseEntity fromCache = cache.get(5);
to this:
Challenges in Modern Software Engineering
The software engineering field nowadays is completely different from what it was 10 years ago. As the scale of IT solutions rises, the complexity of systems is now on an entirely different level. A typical application may have thousands of instances in multiple availability zones. At the same time, the amount of code is usually around hundreds of thousands of lines.
The number of frameworks and libraries used as dependencies in a typical app is also higher than it was before. When it comes to gigantic frameworks that require tons of boilerplate, the Java language is somewhat notorious. The ecosystem carries the largest frameworks ever created. Some examples are Spring, Hibernate, and others.
One of the problems a modern Java developer faces is understanding code quickly. An average engineer spends way more time reading code than writing it. Understanding how libraries and frameworks work under the hood and what they do is extremely vital for proper software development.
Another problem is debugging a running instance of an application in some environment where a classic debugger might not be available. Usually, it’s possible to use logs and APM tracers, but these tools might not always suffice for the needs.
One possible way to mitigate some of these problems is code execution recording (tracing) for later analysis. The idea is by far not new, as there are already dozens of time-travel debuggers for different languages.
Introducing Ulyp: A tracing debugger for Java/Kotlin
Ulyp is an instrumentation agent written specifically for this task. Tracing all function calls along with return values and arguments is possible thanks to JVM bytecode instrumentation. This effectively eliminates the need for breakpoints in certain cases. It’s also feasible to record the execution flow in several apps at the same time via remote control. A developer is able to record and observe what happened in a distributed environment.
All data is dumped to the file a user specified via system properties. There are auxiliary threads that do the job of converting objects to binary format and writing to file. The resulting file can later be opened in the UI app and the entire flow can be analyzed.
Currently, Ulyp uses bytebuddy library, which does an immense job of handling all the work of instrumentation and makes it extremely easy for all Java developers. The rest is relatively straightforward to implement. The ongoing blog posts will shed light on how the tool is implemented. Right now, let’s move to action.
Case Study: Hibernate internals
Let’s start with one of the well-known Java frameworks — Hibernate. We are going to use Spring to set up the demo and use Hibernate with an H2 embedded data source. We will write a very simple code snippet that takes a newly created entity and persists it to the database. We then observe the execution flow by recording it using Ulyp.
The demo is quite straightforward. Our entity is as follows:
@Entity
public class Person {

    @Id
    @GeneratedValue
    private long id;
    @Basic
    private String firstName;
    @Basic
    private String lastName;
    @Basic
    private String phoneNumber;
    @Basic
    private int age;
}
We also have a JPA repository to save entities.
@Repository
public interface PersonRepository extends JpaRepository<Person, Long> {

}
There is also a service that is marked with a transactional annotation, so that it opens a transaction whenever any of its public methods is called.
@Service
@Transactional
public class PersonStoreService {

    @Autowired
    private PersonRepository repository;

    public void save(Person person) {
        repository.save(person);
    }

    public Person find(long id) {
        return repository.findOne(id);
    }
}
Now, we have main method which looks like this:
    public static void main(String[] args) {
        ApplicationContext context = new AnnotationConfigApplicationContext(Configuration.class);
        PersonStoreService store = context.getBean(PersonStoreService.class);

        Person person = new Person();
        person.setFirstName("John");
        person.setLastName("Doe");
        person.setAge(42);

        store.save(person);
        System.out.println("Stored: " + person);

        Person foundPerson = store.find(person.getId());
        System.out.println("Found: " + foundPerson);
    }
The whole code is available at the repo. After we execute the code, it will print the result:
Stored: org.example.hibernate.util.Person@52d14571
Found: org.example.hibernate.util.Person@75268ef2
We’d like to understand what exactly happened when we call the code. Let’s start using Ulyp. The only thing we need to do is to specify system properties; nothing else is changed.
-javaagent:/home/user/ulyp-agent-1.0.0.jar
-Dulyp.file=/tmp/test-spring.dat
-Dulyp.methods=**.PersonStoreService.*
-Dulyp.record-constructors
-Dulyp.record-collections=JDK
-Dulyp.record-arrays
The first property tells the JVM that the agent should be used. The second property ulyp.file specifies the file
path where ulyp should store all recorded data. The next property tells Ulyp when it should start recording.
In this case, whenever any method of a class named PersonStoreService is called,
ulyp will start recording all nested calls. ulyp.record-constructors tells it to instrument and record constructors,
and ulyp.record-collections=JDK allows it to partially record collection values, but only for JDK standard library collections.
The collections themselves are not instrumented, i.e., Ulyp does not record calls like ArrayList.add, but can record some
items from ArrayList if it is passed as an argument (or returned from) to some recorded method call.
After running the demo with properties set, we can upload the file to the UI desktop app. The first thing we see is the list of recorded methods on the left.
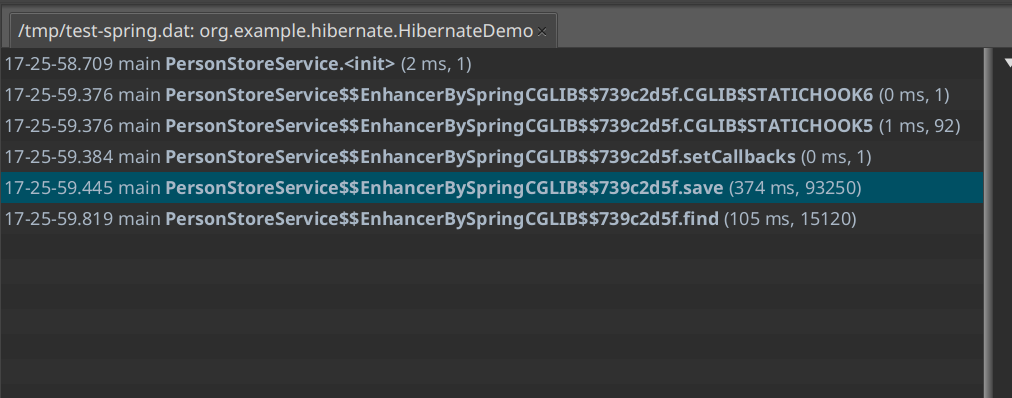
Every entry in the list is a recorded method call of some instance of the PersonStoreService class.
We can also see the duration of methods, as well as the number of recorded calls inside.
There are 90,000 calls for just storing an entity with Spring, Hibernate, and H2 inside.
But keep in mind, there is a lot of bootstrapping done once the method is called for the first time.
The next call would probably have fewer methods recorded. Duration is also quite high for storing just a
single entity. There is an explanation for this — not only was there not enough time for the JVM to warm up,
but we also instrumented all third-party classes, as well as recorded all method calls.
There are benchmarks that measure the overhead of instrumenting and recording apps.
The data shows that for a typical enterprise app, the overhead is around x3-x5 with proper warm-up
compared to not using the agent at all.
Another thing you probably noticed is that the name of the class is PersonStoreService$$EnhancerBySpringCGLIB$$739c2d5f
rather than just PersonStoreService. That’s simply because the class is marked with the @Transactional annotation.
Spring will create a proxy for managing transactions, and then recording starts upon the proxy call.
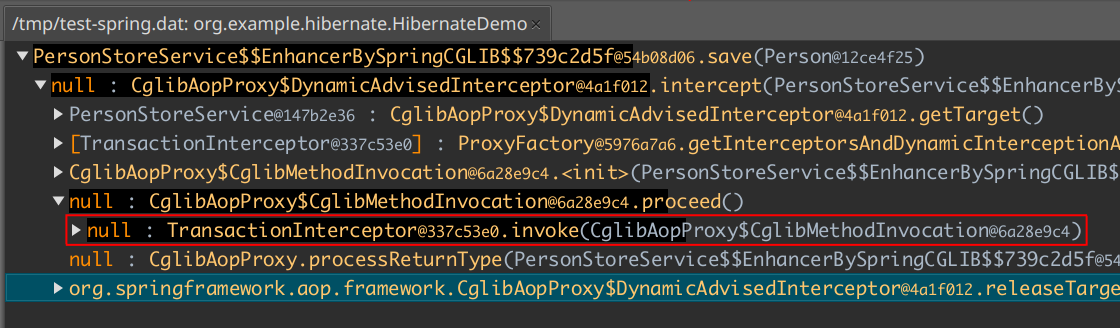
Let’s dive deep into the save method recorded calls. The recording data is presented in the form of a tree with collapsible nodes.
Every node is a recorded method call. Nodes are also marked with a black pane that hints at how many nested calls a
node has compared to the other nodes. The first thing we can see is that the Spring proxy actually
calls the instance of TransactionInterceptor:
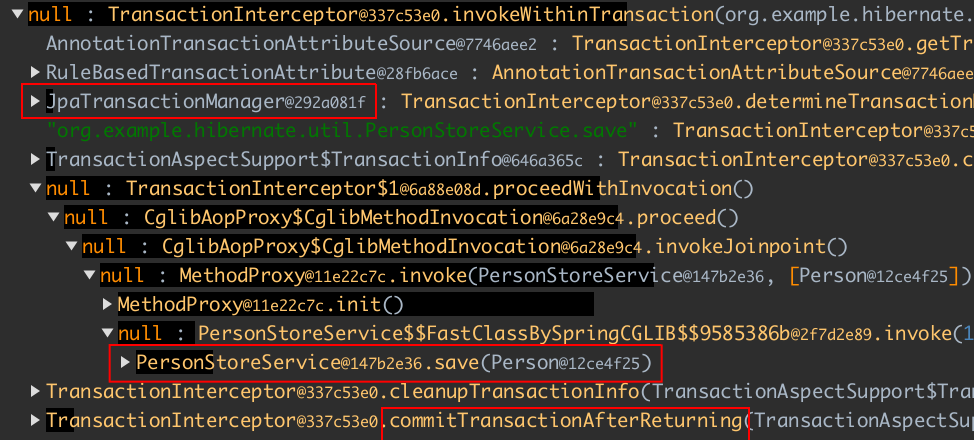
If we dive deeper, we can see that our PersonStoreService is called after the transaction is started.
Our transaction manager is an instance of the JpaTransactionManager class. We can also see a call to
TransactionInterceptor.commitTransactionAfterReturning where the opened transaction is supposedly committed.
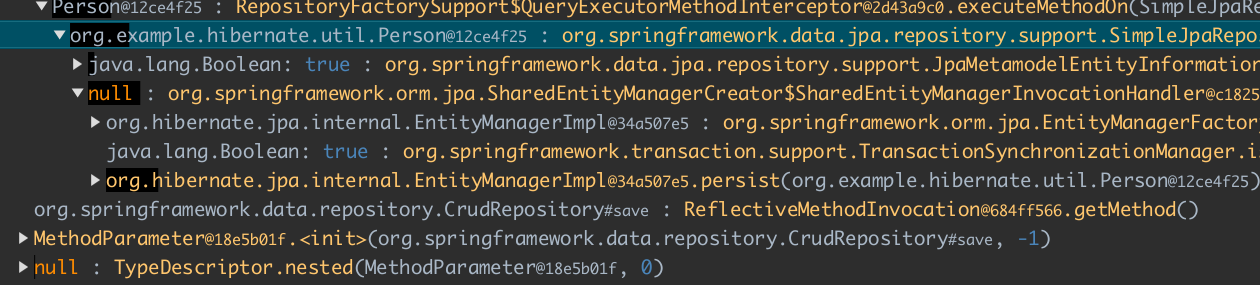
Further exploration points to where the instance of EntityManager is called:
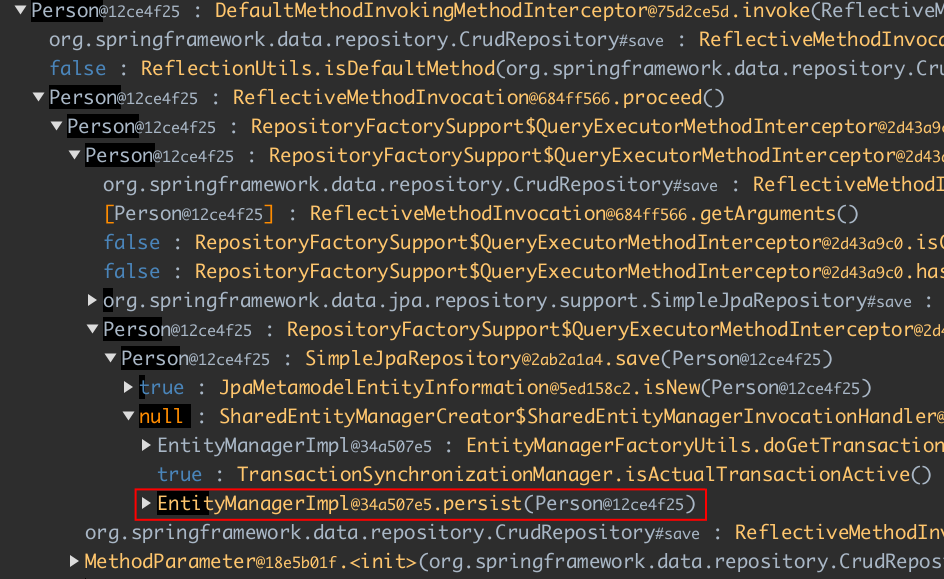
At this point we see only simple class names (i.e., no package name), and it might be hard to tell which classes belong to Hibernate. That’s exactly why Ulyp can show full class names. Just select a node and hold the Shift button, and you will see fully qualified names:
If we wanted to, we could dive deep down to the H2 database level where JDBC statements are created and executed (this happens when the transaction is committed).
Conclusion
This was a simple demo of using Ulyp. Other cases include (but are not limited to):
- tracing distributed systems running in clouds
- gathering gigs of data for later analysis
- tracing real-time apps where stopping a thread using a conventional debugger is not an option
- finding inefficiencies in gigantic frameworks
Ulyp doesn’t try to solve all the existing problems and it’s definitely not a silver bullet. The overhead of instrumenting could be quite high. You might not want to run it on a production environment, but dev/test are usually okay. But if one can run their software app locally or on a dev environment, it opens the opportunity to see things from a completely different angle.